Azure Log Analytics can be used to collect logs centrally on Azure from which we can run log queries with the data in Azure monitor logs. Thus Log Analytics Workspace serves as a logical storage unit where you can quickly store, keep, and query information gathered from multiple resources that have been monitored in Azure to offer insightful data for those resources.
What Is the Difference Between Azure Monitor and Log Analytics?
Azure log analytics is an offering or service within Azure Monitor. Azure log analytics and App Insights have been moved into Azure Monitor to provide a consolidated monitoring experience in one place. The term log analytics now primarily applies to the page in the Azure portal used to write and run queries and analyze log data.
Creating a Log Analytics Workspace for Azure Monitoring
Azure Log Analytics workspace is a central place where you can monitor and manage all the Azure Monitor logs collected from one or more Azure resources.
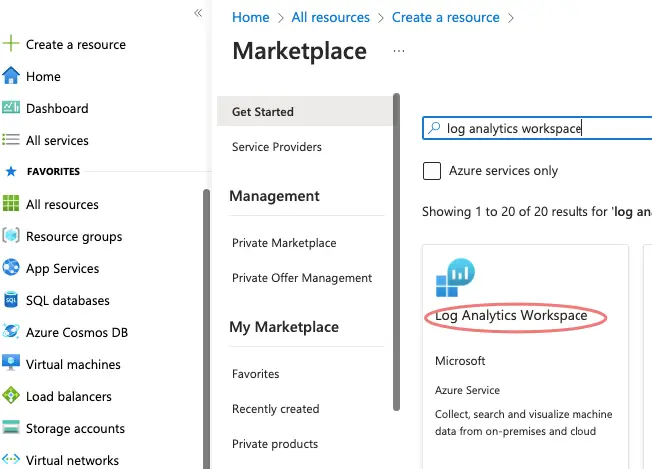
Log in and search for Log Analytics Workspace.
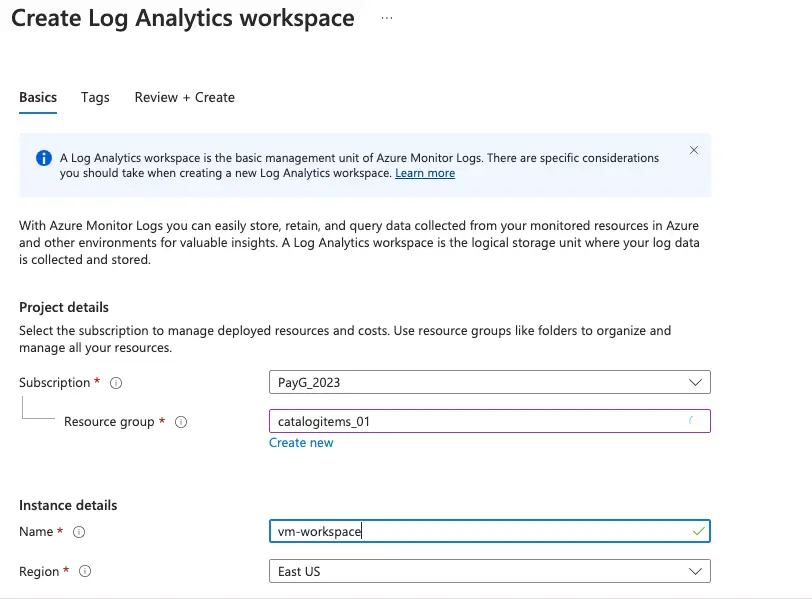
- Fill in the details like:
- Workspace name
- Subscription name
- Resource group name
- Location
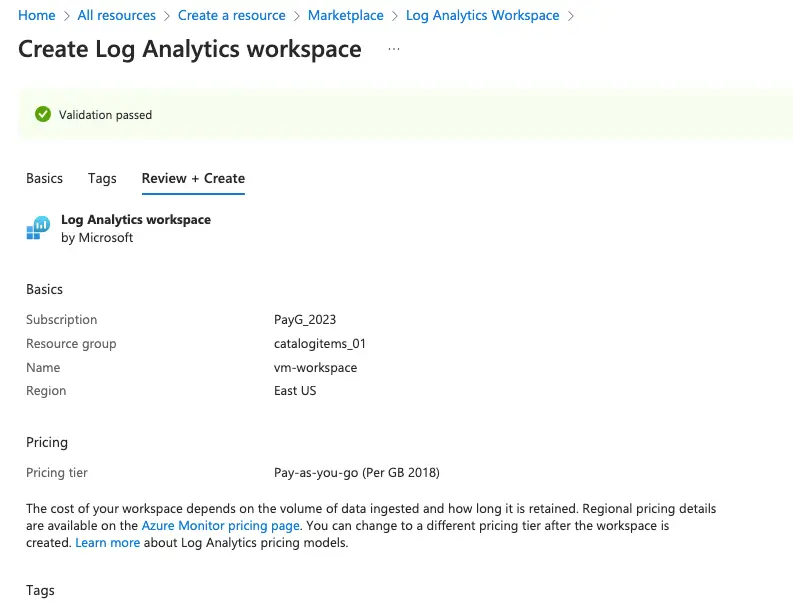
- Pricing tier
Click Review and Create to begin the provisioning
Defining a Log Analytics Data Collection Rule
Its data collection rules that determines how alerts are going to be collected on the loganalytics workspace.
Open the Azure Monitor Service to create data collection.
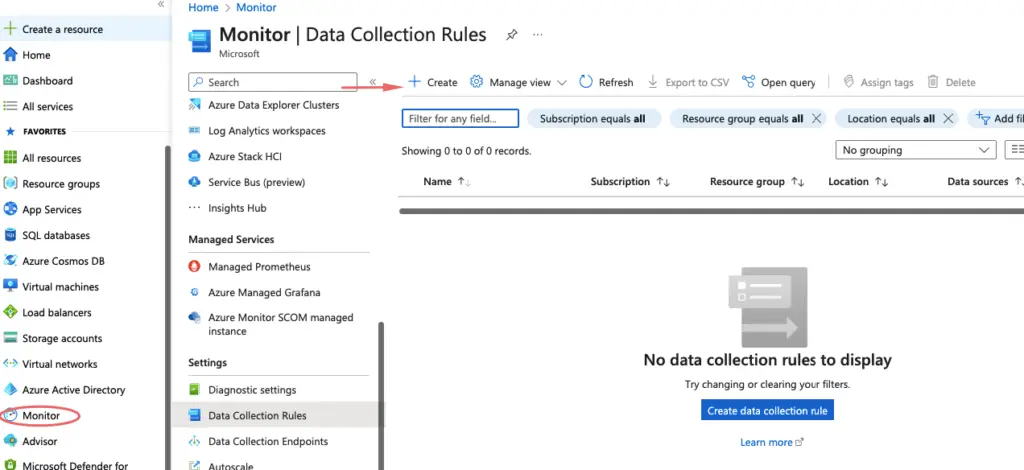
Generating Alerts based on Metrics
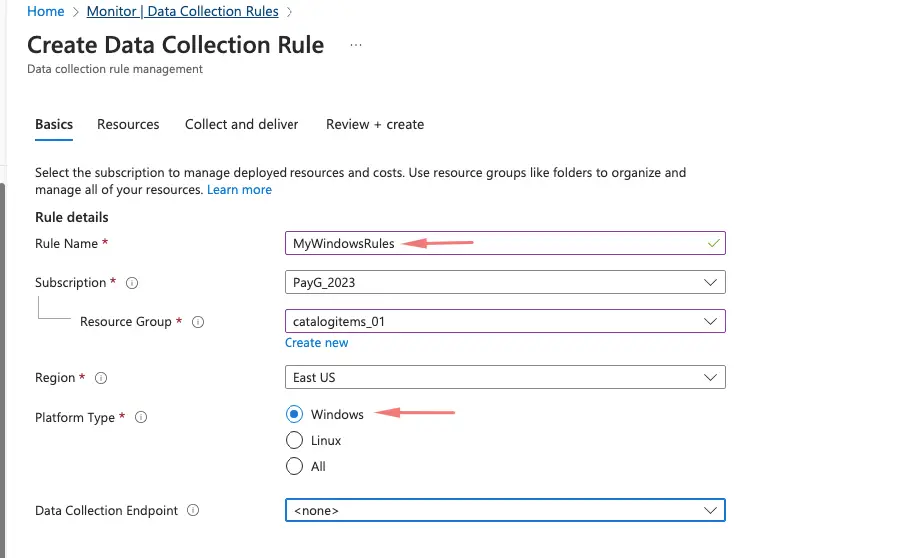
- Fill in the details like:
- Rule name
- Subscription name
- Resource group name
- Platform Type – Choose the OS as Windows
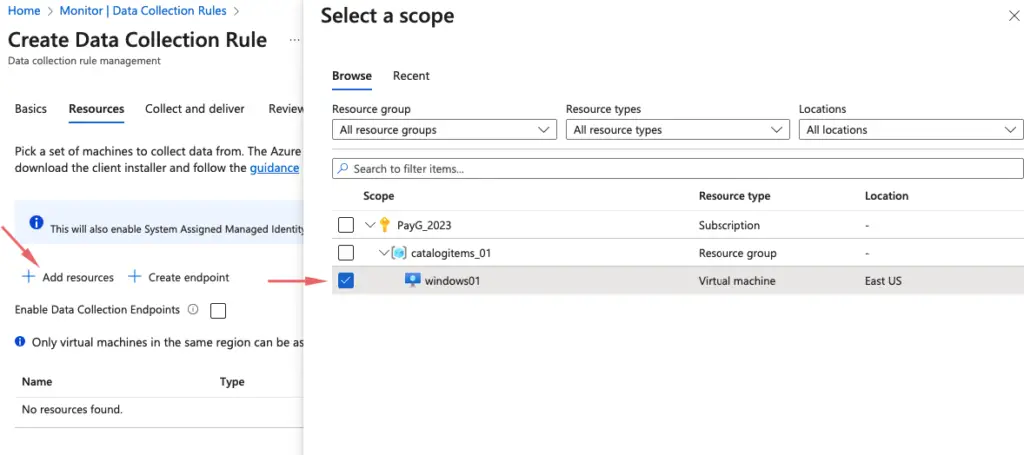
Select the resources we wish to monitor so we will pick our windows VM in here. Analyse the logs on the Windows machine and send it to the workspace is what this actually does.
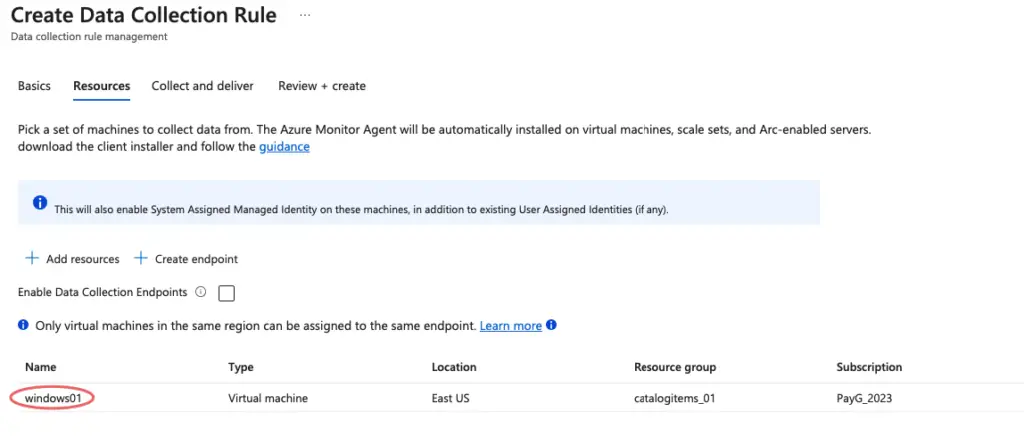
Our VM is thus added
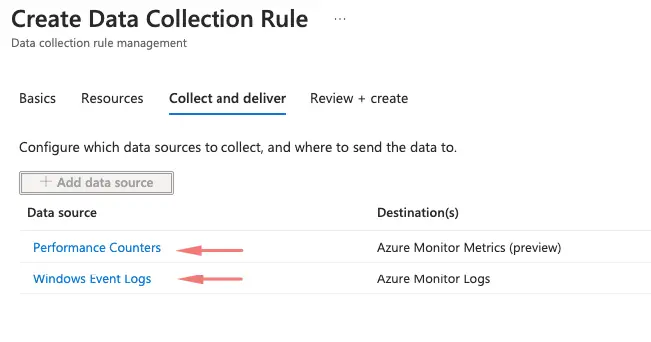
There are two datasources we can use
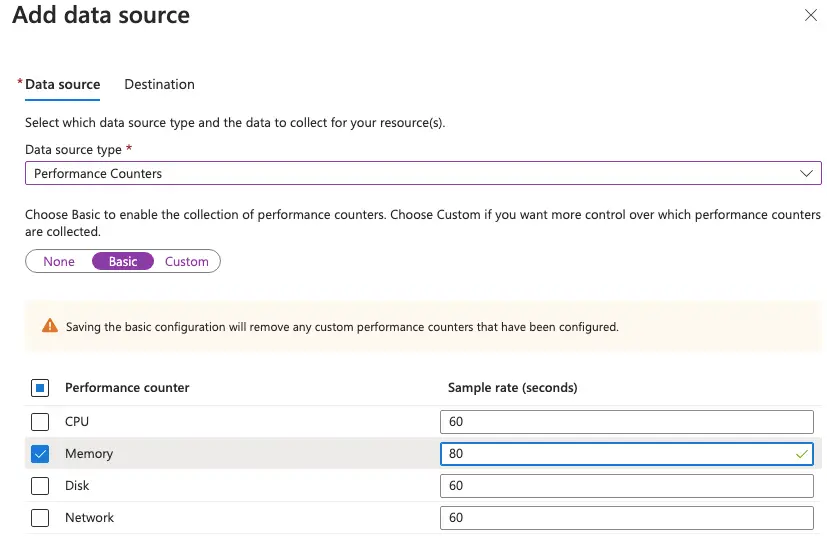
- Data source type – Perf Counters such as CPU. Memory etc
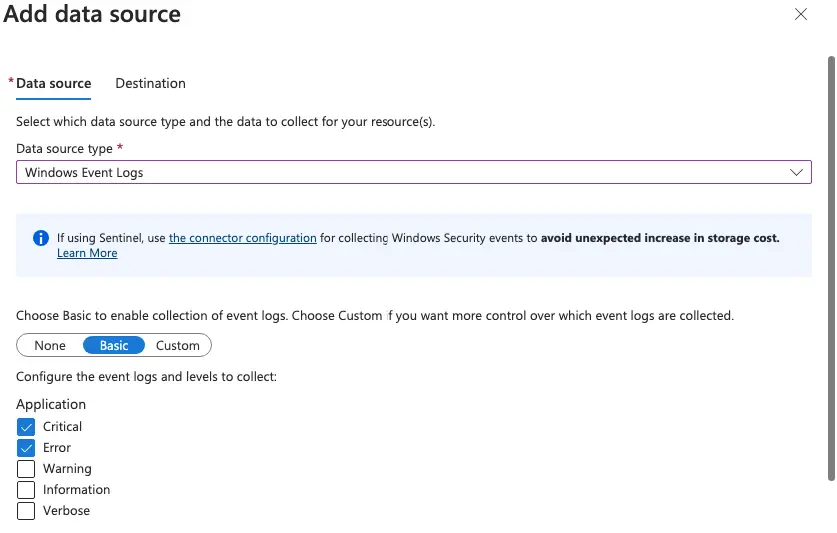
- Data source type – Windows Event Viewer Logs based on its severity
For us to analyse the logs based on “metrics” on the Windows machine and send it to the workspace I will just choose memory metric here.
Under Windows Event logs as this is an IIS server, we will choose all the Critical warnings being generated
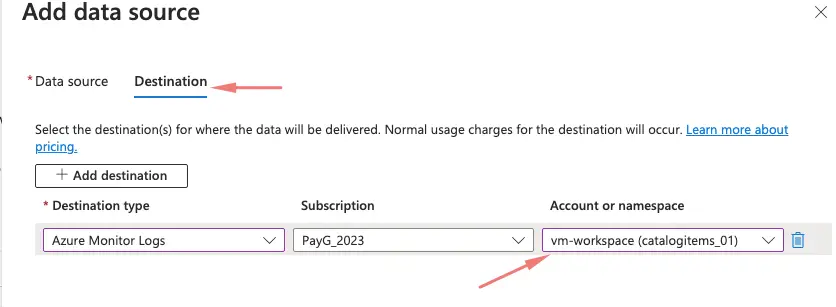
Under the destination tab choose the workspace we created so logs are directed to the Workspace
Our Windows Event Logs and Perf Counter data collection rule is now enabled
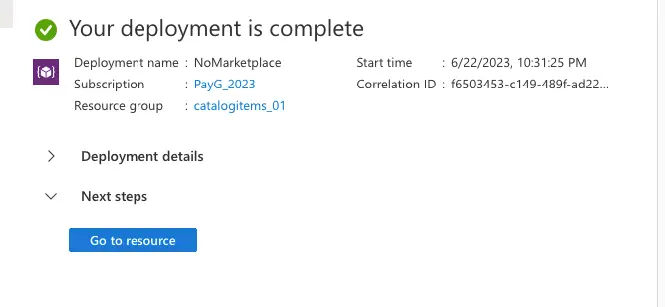
Click Review and Create for our Workspace to be created
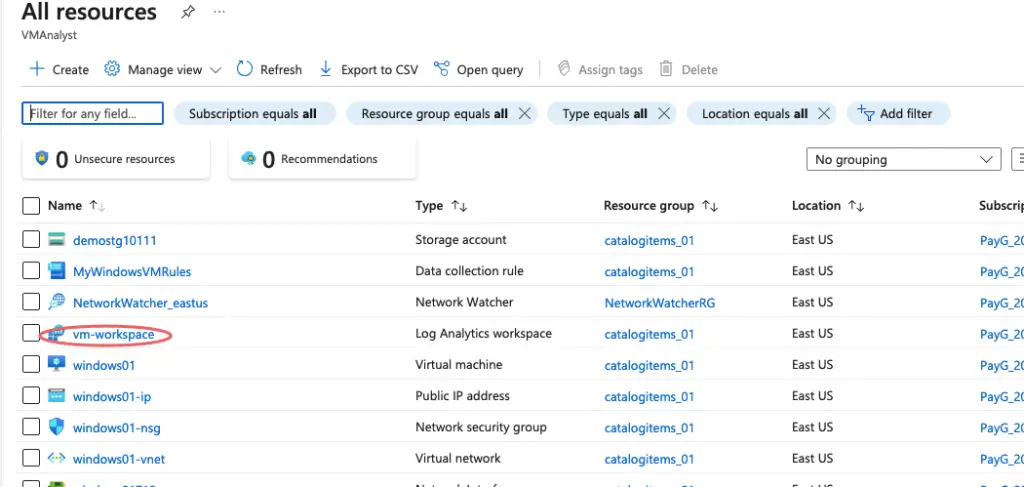
All resources section will now show us the workspace and also the data collection rule
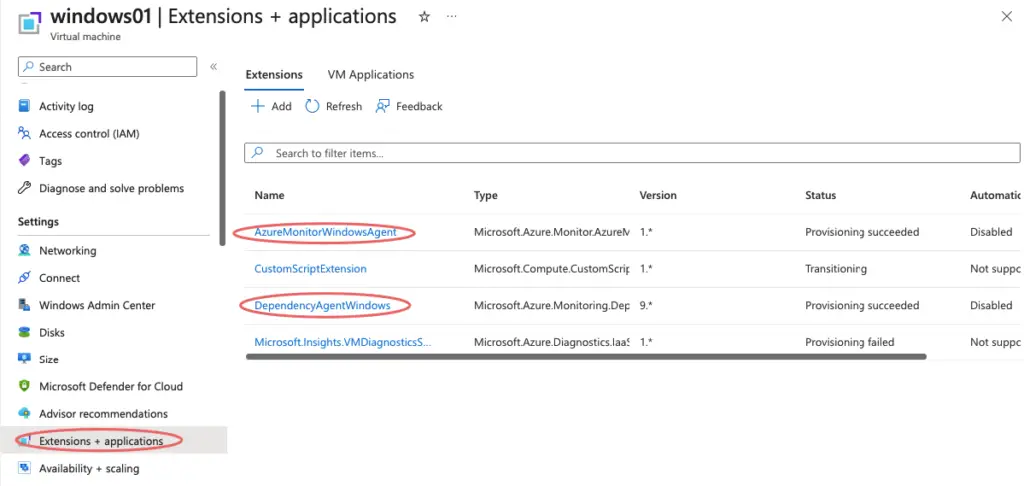
On the VM, this will create two agents on it as shown
Adding Additional VM’s to Log Analytics Workspace
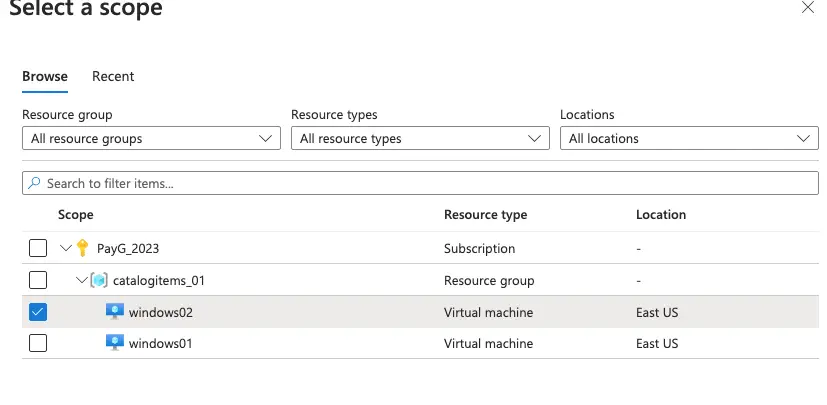
In this section, we now add our new VM to an existing log analytics space. The easiest way to do this is go to the Azure Monitor and then go the data collection rules and add the new VM in.
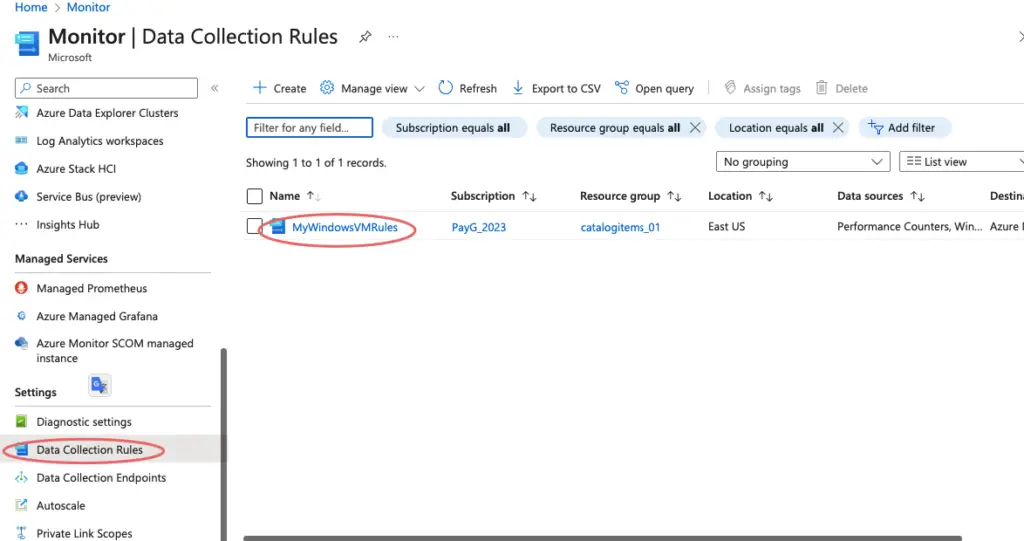
Click Add button to add the new VM in
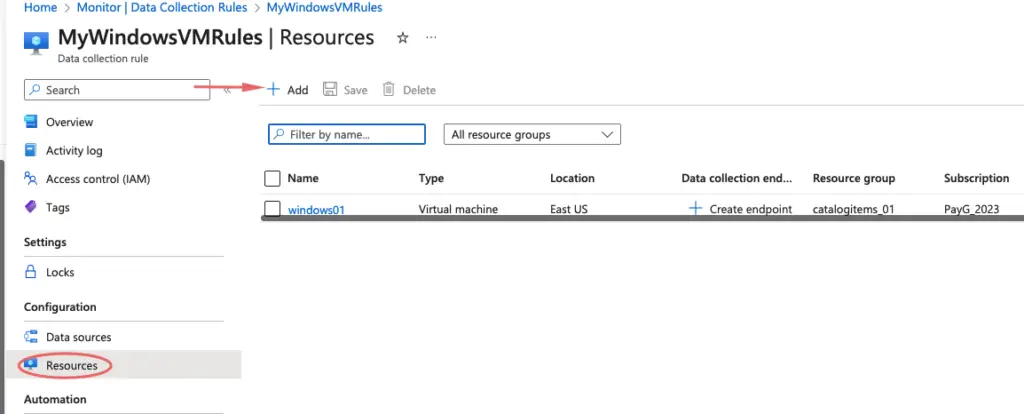
Our second VM is thus added in.
After few minutes, we can now see logs being generated in the Workspace tab.
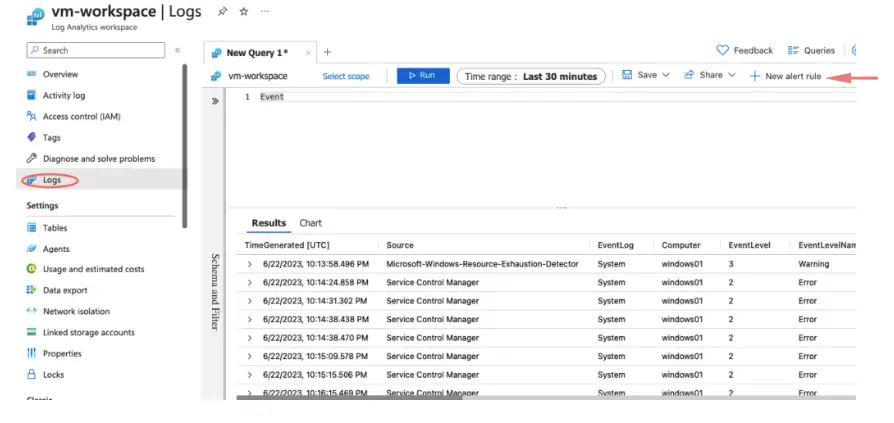
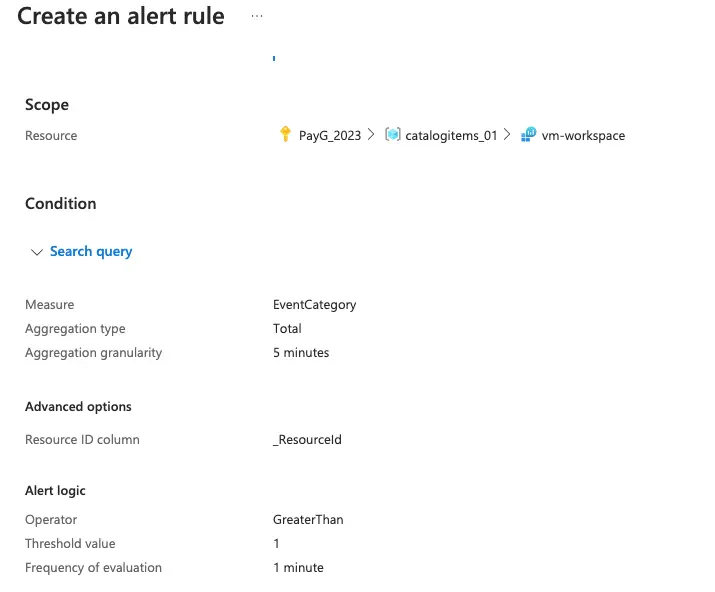
Alert rules to email etc can be created from here.
Some Log Analytics Queries
1. This can be used to check for the events generated in the previous 5 minutes
Event | where TimeGenerated > ago(10m)
2. This can be used to project certain properties
Event | where TimeGenerated > ago(5m) | project EventLog, Computer

