Part 18 – vSAN Performance Issues
Skyline Health Overview
Skyline Health is embedded in vCenter. No installation is required. From the vSphere Client, select the vSAN cluster in the left navigation pane. In the right pane, click the Monitor tab and select vSAN > Skyline Health. A perfect score is 100, which means that no problems are detected. Each health check finding subtracts points from the cluster health score.

Score ranges:
- Green – from 81 to 100:
- Healthy cluster.
- No immediate attention is required.
- Yellow – 60 to 80:
- Cluster health degraded.
- Attention is suggested but is not critical.
- Red – 1 to 59:
- Unhealthy cluster.
- Immediate attention is required.
Health Score Trend
You can change the default time range of 24 hours to a custom date range. You can also check the score and detailed health findings of a single point in the past.
The database stores the health data for up to 30 days depending on the available capacity.
To deactivate the health history, select the cluster, navigate to Configure > vSAN > Services > Historical Health Service, and click Disable.
Health Check Findings Status
Health check findings have one of the following statuses:
- Unhealthy: Critical or important issues are detected that need attention.
- Healthy: No issues were found that need attention.
- Silenced: Health findings have been silenced.
- Info: Health findings were detected that do not impact the cluster running state but are important for awareness.
vSAN Health Check Categories
The Skyline Health checks are organized into multiple categories:
- Hardware Compatibility
- Performance Service
- Network
- Physical Disk
- Data
- Cluster
- Capacity Utilization
- Online Health
- vSAN Build Recommendation
- vSAN iSCSI Target Service
- Data-at-Rest Encryption
- Data-in-Transit Encryption
- File Service
- Stretched Cluster
- Hyperconverged Cluster Configuration Compliance
Object Repair Time
The default health check interval is 60 minutes. You can check or change the interval through PowerCLI:
#The accepted values are in the range of 15 minutes to one day (1440 minutes).
Get-VsanClusterConfiguration $cluster |select -ExpandProperty HealthCheckIntervalMinutes
Set-VsanClusterConfiguration -Configuration (Get-VsanClusterConfiguration $cluster) -HealthCheckIntervalMinutes 120
If HealthCheckIntervalMinutes is set to 0, that health check is disabled.
vSAN Support Insight
vSAN Support Insight is a platform that helps you maintain a reliable and consistent compute, storage, and network environment. VMware support uses vSAN Support Insight to monitor vSAN performance diagnostics and resolve performance issues.
Some online health checks are available only through vSAN Support Insight. To benefit from them, vCenter must be connected to the Internet. vSAN uses the Customer Experience Improvement Program (CEIP) to send data to VMware for analysis on a regular basis.
To join the Customer Experience Improvement Program (CEIP), go to vSphere Client > Administration > Customer Experience Improvement Program > Join.
Ensure that vCenter can reach the Internet, specifically, the https://vcsa.vmware.com:443 URL.
Skyline Advisor and Skyline Health Diagnostics are separate tools. They should not be confused with Skyline Health for vSAN.
Introduction to the esxcli vsan Command
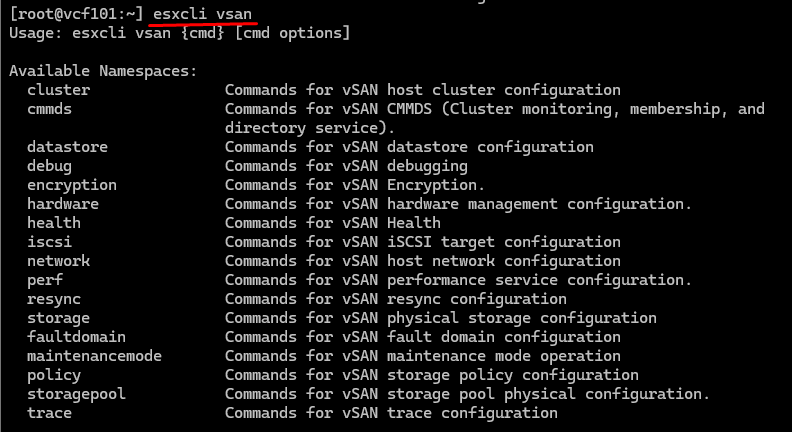
The esxcli vsan command offers the following namespaces and ESXCLI functions.
[root@vcf101:~] esxcli vsan Usage: esxcli vsan {cmd} [cmd options]
Checking vSAN Cluster Health (1)
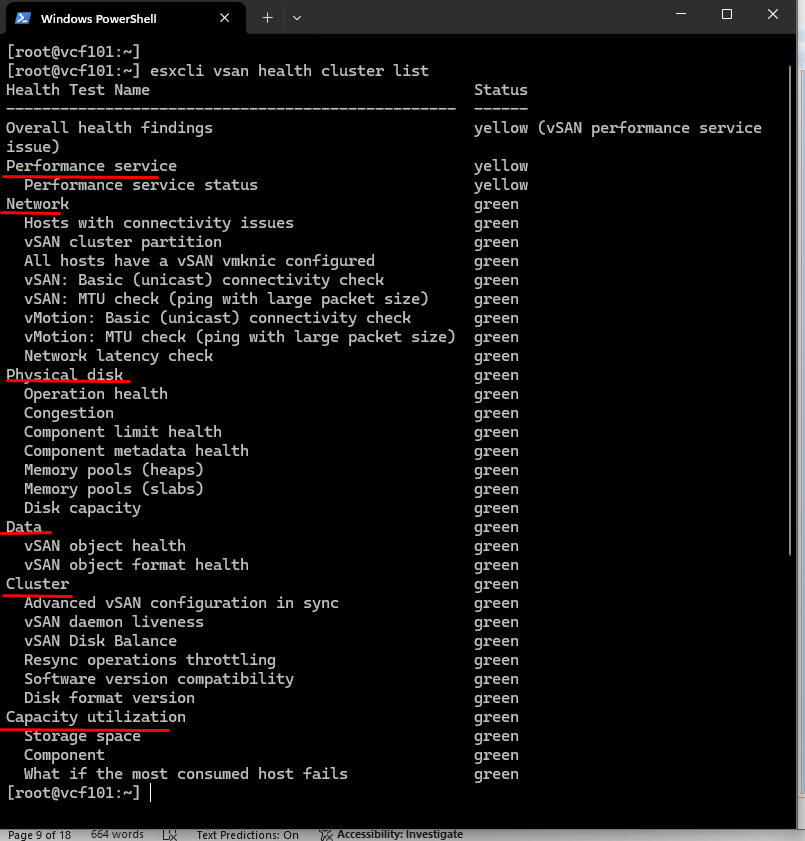
You can use the esxcli vsan health cluster list command to check the vSAN cluster health.
[root@sa-esxi-07:~] esxcli vsan health cluster list

..
Checking vSAN Cluster Health (2)
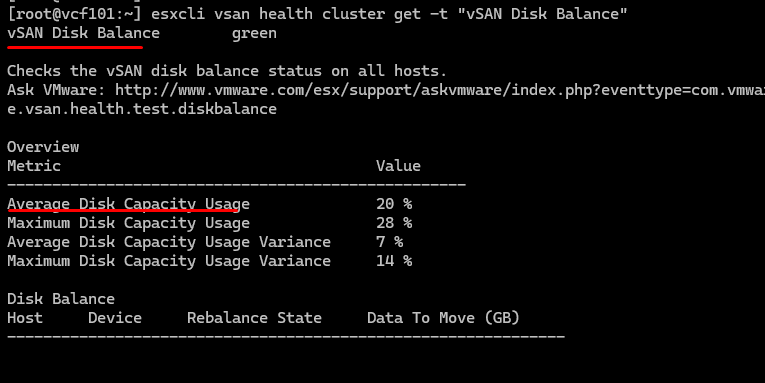
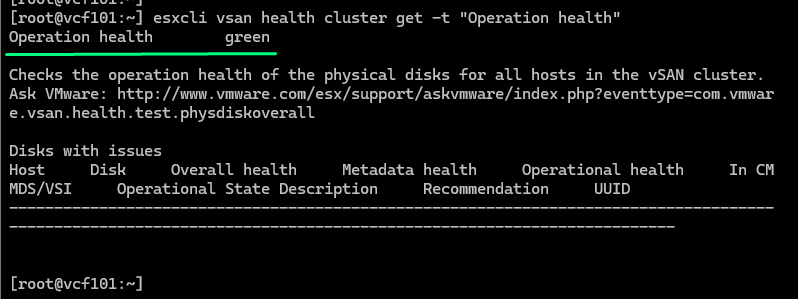
The esxcli vsan health cluster get –t <name_of_test> command returns the reason for the test result.
[root@vcf101:~] esxcli vsan health cluster get -t “vSAN Disk Balance”
Checks the vSAN disk balance status on all hosts.
Viewing Cluster Information
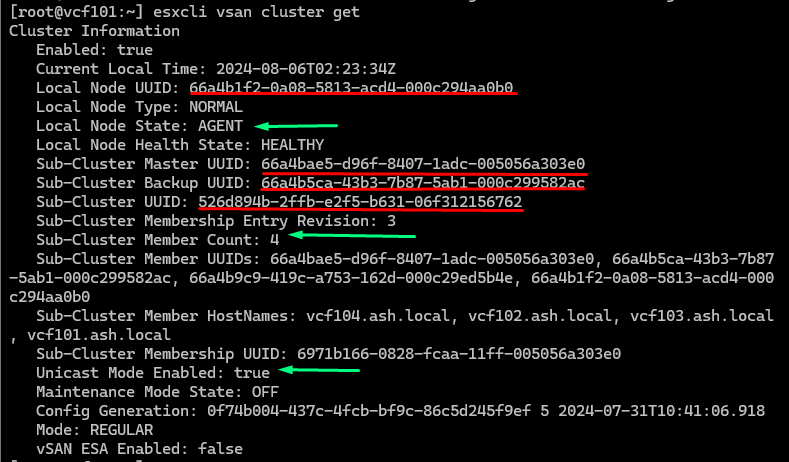
You can use the esxcli vsan cluster get command to view cluster information.
Viewing Disk Group Information
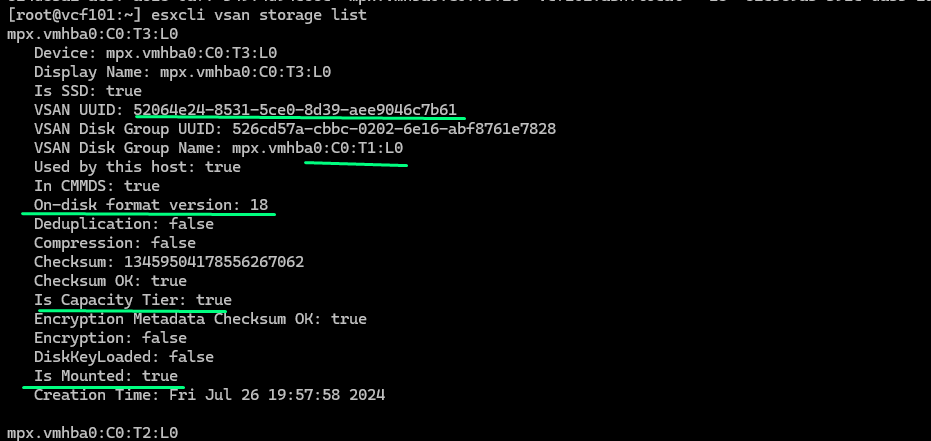
Use the esxcli vsan storage list command to view vSAN OAS disk information for vSAN.
[root@vcf101:~] esxcli vsan storage list
Viewing Storagepool Information
You can use the esxcli vsan storagepool list command to view vSAN ESA storagepool information.
[root@vcf101:~] esxcli vsan storage list

Viewing vSAN Network Information
You use the esxcli vsan network command to gather information about the vSAN network and other network-related information.
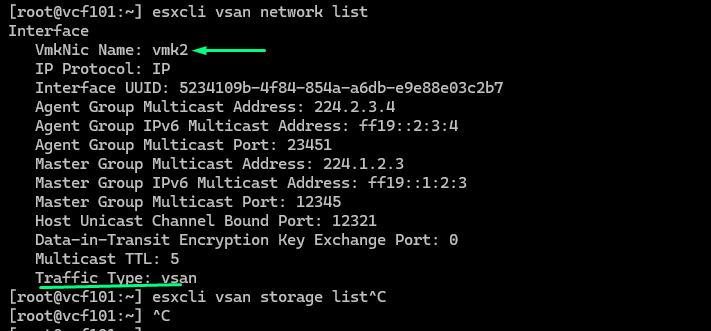
You use the esxcli vsan network list command to verify which VMkernel ports are used by vSAN.
[root@vcf101:~] esxcli vsan network list
Network Connectivity Check
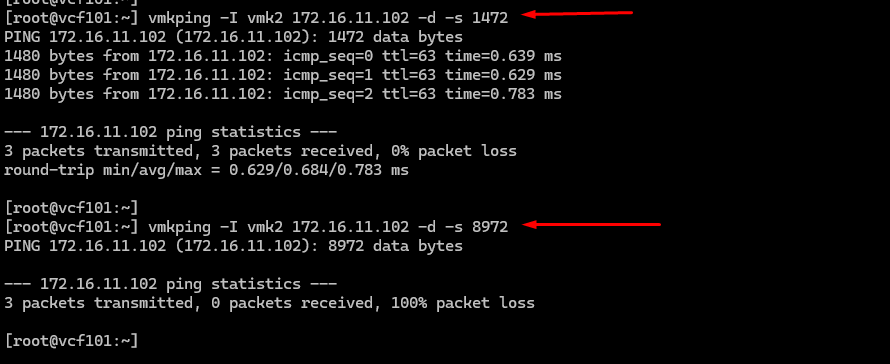
You can use the vmkping command to test the connectivity between vSAN nodes using the command
vmkping -I <vSAN_VMkernel_interface> <node_hostname_or_IP_address>
If you have Jumbo Frames configured in your environment, run the vmkping command with the -s and -d options: vmkping -I vmkX -d -s 8972 x.x.x.x
To test 1500 MTU, run the vmkping -I <vSAN_VMKernel_interface> <node_hostname_or_IP_address> -d -s 1472 command. -disables fragmentation.
Viewing the Unicast Table
You can use the esxcli vsan cluster unicastagent list command to view the unicast table. The unicast table has information about other hosts in the cluster used for network connections such as NodeUuid, IP Address, and Port.
[root@vcf101:~] esxcli vsan cluster unicastagent list
Example from a four-node standard cluster:

Using the esxcli vsan debug Command
You can use the debug namespace to troubleshoot vSAN.
[root@sa-esxi-07:~] esxcli vsan debug
Usage: esxcli vsan debug {cmd} [cmd options]

You can work with cluster health, objects, disks, and more with esxcli vsan debug command. Some examples are provided in this lesson.
Viewing Object Health Summary
You can use the esxcli vsan debug object health summary get command to determine the current vSAN object states.
[root@sa-esxi-07:~] esxcli vsan debug object health summary getHealth Status
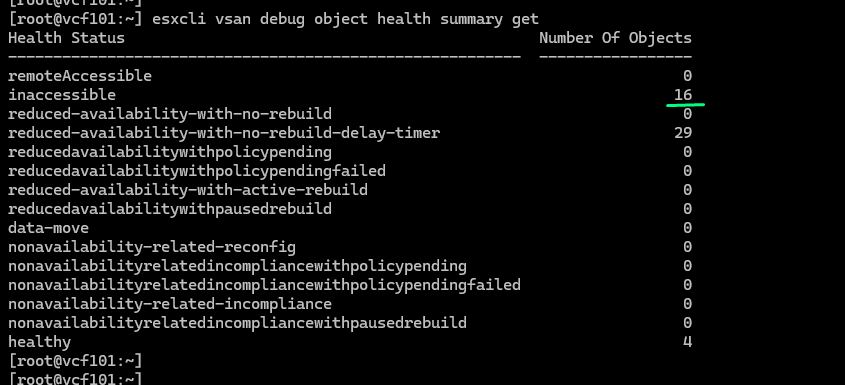
For more information about the object’s possible states, see VMware knowledge base article 2108319 at https://kb.vmware.com/s/article/2108319.
Listing vSAN Objects
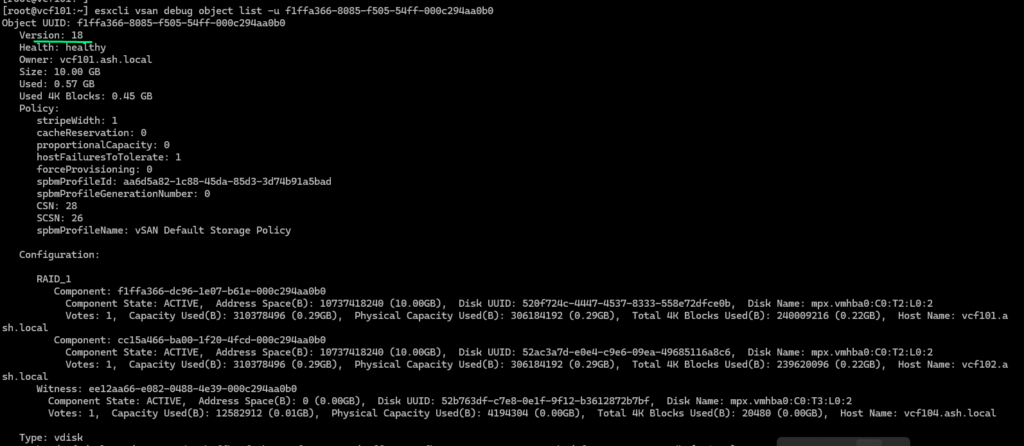
You can use the esxcli vsan debug object list command to list vSAN objects.
It can take a long time to execute the command so we will redirect it to an output file .

To check the details of one object, details use the esxcli vsan debug object list -u UUID command.
[root@vcf101:~] head -100 /tmp/output.txt | grep -i “Object”
Object UUID: f1ffa366-8085-f505-54ff-000c294aa0b0
Object UUID: 74a6a466-62b3-e112-d5bf-000c294aa0b0
Object UUID: efffa366-20b7-8028-06bc-000c294aa0b0
Investigating Object Health
You use the esxcli vsan debug object overview command to display the health information summary of vSAN objects.
Under Healthy Components, all components should be healthy, for example, 3 of 3 or 2 of 2.

Listing vSAN Disks
You can use the esxcli vsan debug disk overview command to list all vSAN disks in a cluster. A trimmed example:
[root@sa-esxi-07:~] esxcli vsan debug disk overview
Example for vSAN ESA cluster
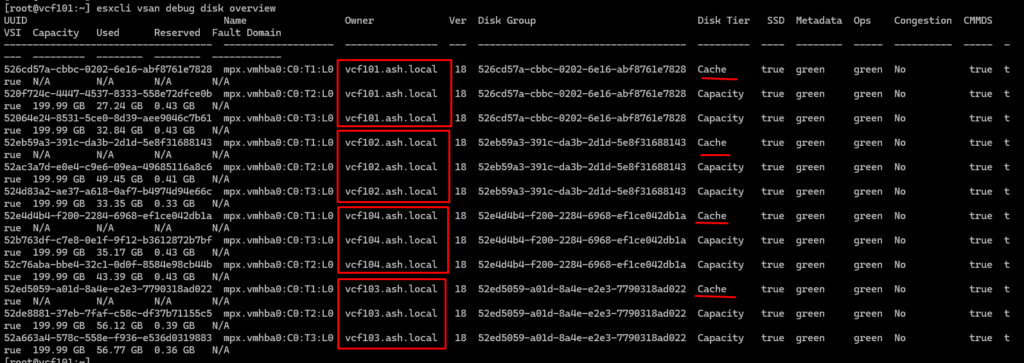
[root@sa-esxi-09:~] esxcli vsan debug disk overview
Listing vSAN VMDKs
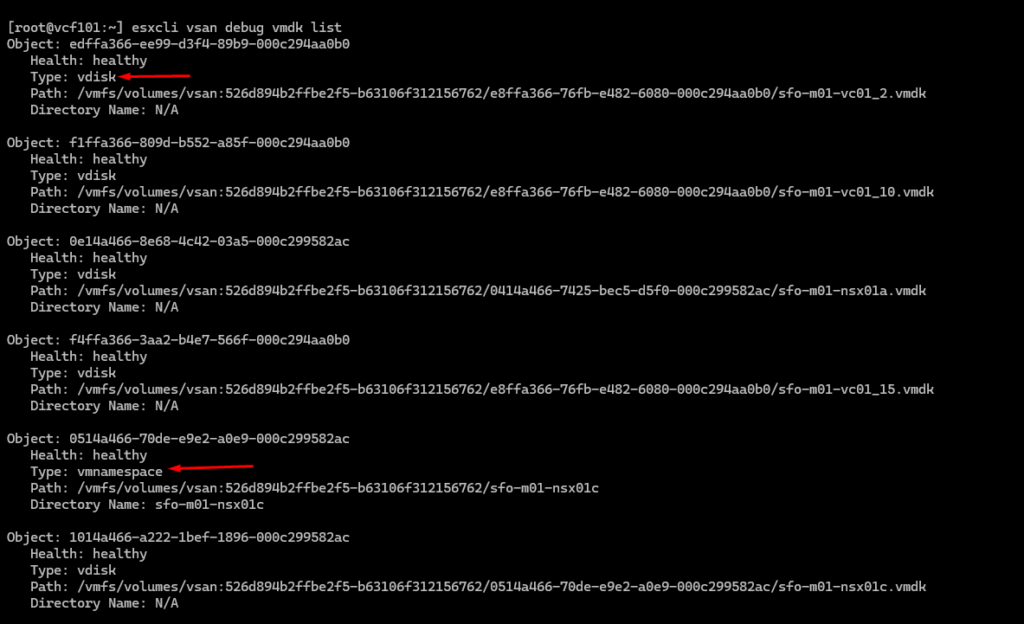
You can use the esxcli vsan debug vmdk list command to list all the VMDKs and VM Home Namespaces.
[root@vcf101:~] esxcli vsan debug vmdk list
Investigating vSAN Controllers
You use the esxcli vsan debug controller list command to query the controller for its information.
[root@vcf101:~] esxcli vsan debug controller list
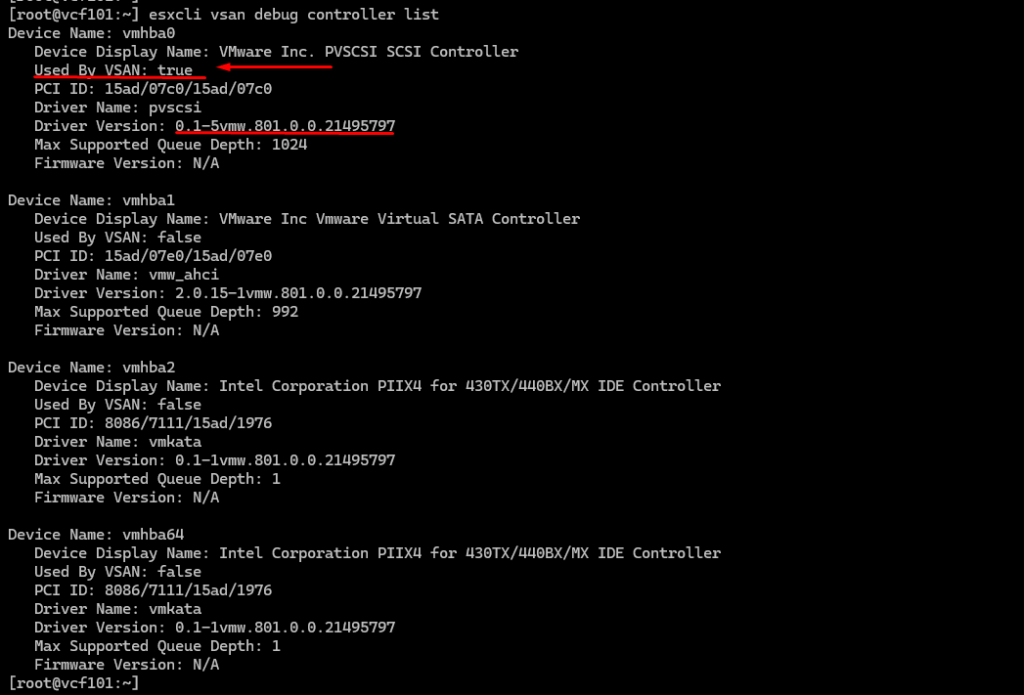
To check the controller statistics, use the esxcli storage core adapter stats get command. The command is illustrated in the course.
Investigating vSAN Fault Domains
The esxcli vsan faultdomain get command shows whether a host is a member of a fault domain.
About the vdq Command
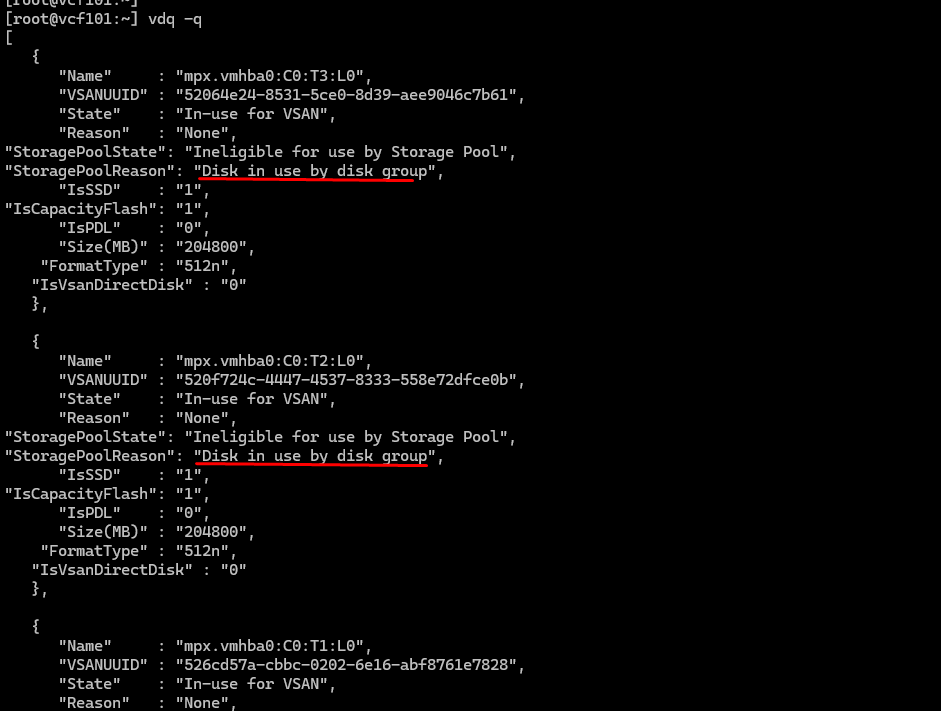
You can use the vdq command to view disks vSAN related information.
Example of showing disk information:
[root@vcf101:~] vdq -q
About the vsantop Command
The vsantop command is a powerful performance monitoring tool in vSAN, designed to provide real-time, granular performance metrics tailored to vSAN’s architecture. It allows you to analyze key components such as cache and capacity disks, hosts, and other vSAN entities. By pressing the E key, you can easily switch between different entity types to view their specific performance data. This tool is invaluable for troubleshooting and optimizing vSAN environments, offering live insights into resource usage and potential bottlenecks. For a detailed guide on using vsantop, check out VMware’s official resource: Getting Started with vsantop.
Capturing Network Traffic
In vSphere, the pktcap-uw command is the recommended tool for capturing network traffic at different points in the network, such as VMkernel adapters or uplinks. While the older tcpdump-uw command can still be used for tasks like filtering traffic on specific ports (e.g., tcpdump-uw -i vmk1 port 2233), it is slated for deprecation in future releases. For advanced traffic analysis and better functionality, transitioning to pktcap-uw is the way forward.


