
Azure works on a consumption-based pricing model so In this section, we will focus on the daily cost breakdown of Azure using Azure Cost calculators available on the Azure portal.
Azure Boot Diagnostics
Boot diagnostics on a VM help us to see the boot screen of an OS from a console. This will require the use of a storage account to enable this feature

Azure Monitor
It’s a solution to collect metrics from Azure all the time. It provides detailed monitoring across all Azure services which can be scoped as per our requirements.
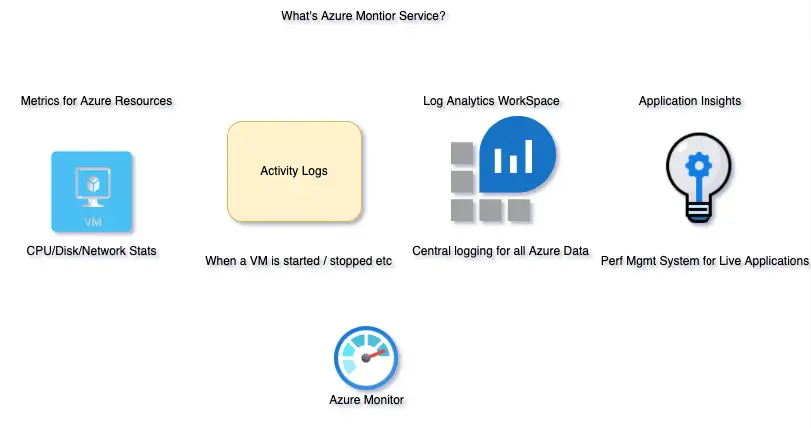
Log Analytics Workspace
A central place to store all the metric logs collected by Azure monitor. Read this section to know how to configure it
Application Insights
Gathers performance data from an application that’s deployed by developers to gather deeper insights like how well its application usage is, customer feedback etc.
How to plot data on Azure Metrics-Alerting – CPU Memory and Disk Usage Email Alerts in Azure
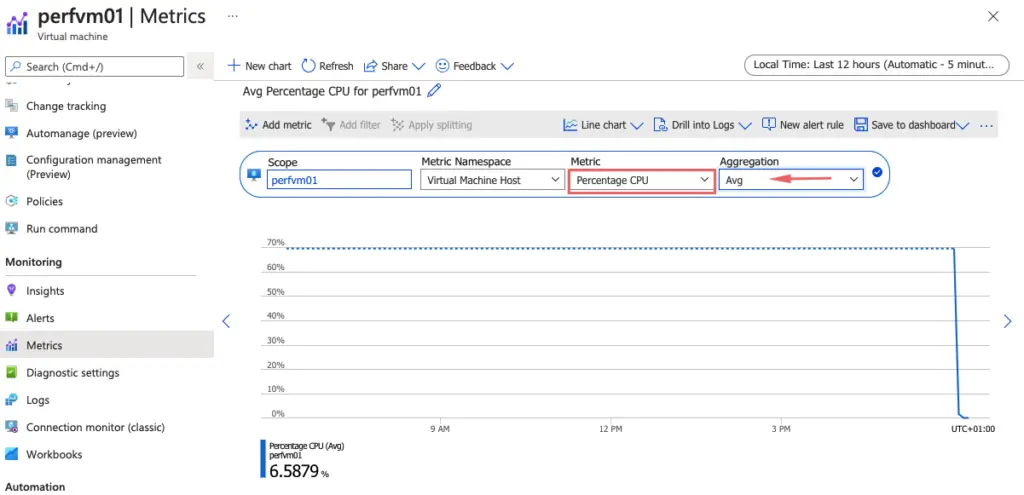
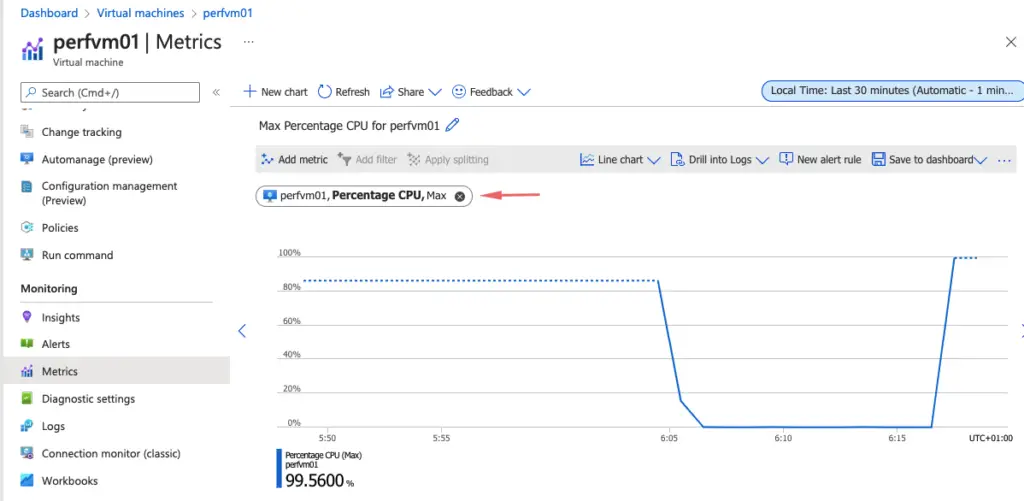
The general health or performance of an Azure resource can be monitored using Azure Metrics. They offer a neat way to organize the usage pattern ( CPU, memory, etc ) that can be used to monitor health. Historical records for up to 3 months can be viewed using Azure Metrics.

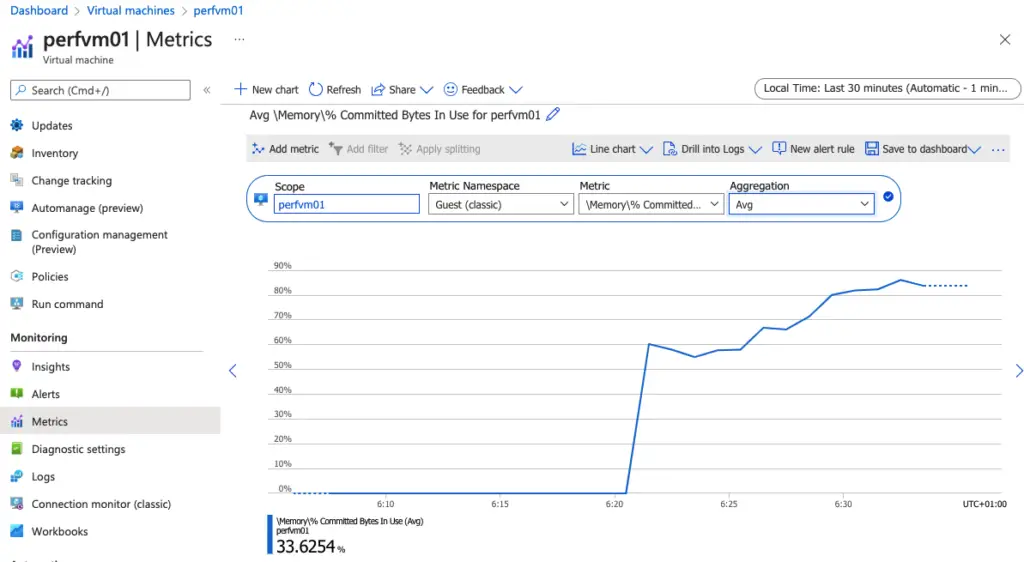
Under Monitor > Metrics we can see the allocation of resources

Your computer’s operating system is constantly allocating resources to different tasks.
CPU randomly runs at around 100% CPU. When stoping and deallocating the VM the credits will be reset to a baseline we had the backup job running on Monday and Tuesday, so CPU usage was VMs here
Enable guest level monitoring to capture detailed memory stats
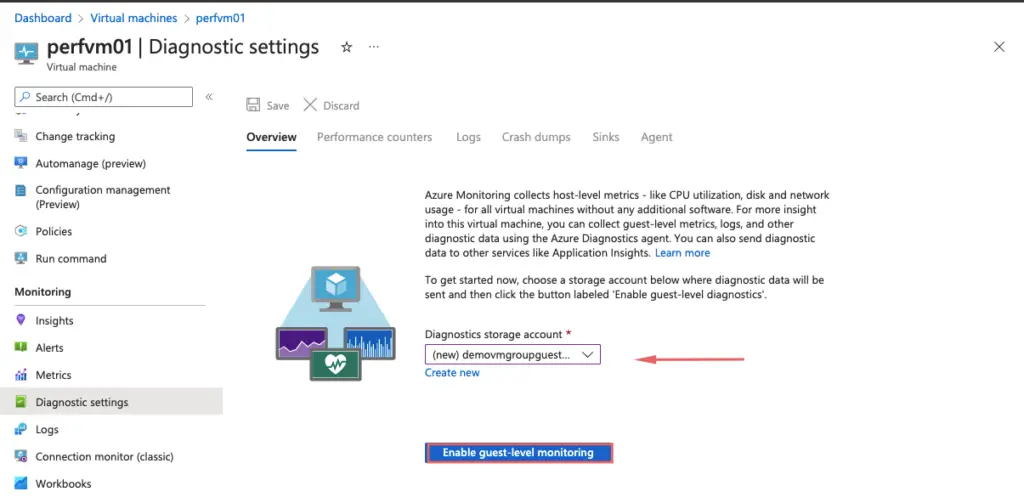
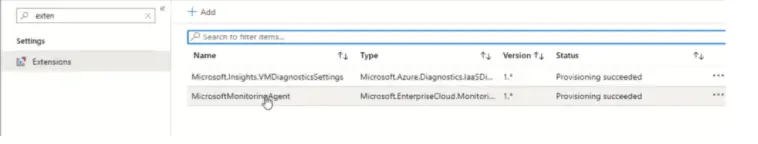
Under VM, we can see extensions which is an agent that’s pushed when the diagnostic agent is enabled.
Few more perf parameters are added to the CPU when diagnostic accounts are turned on

Move to the basic tab and highlight all perf counters we wish to monitor

We can change the sample rate here if needed.

Once diagnostic logs are enabled, we can see a guest(classic) entry and we get more data else also we get some data

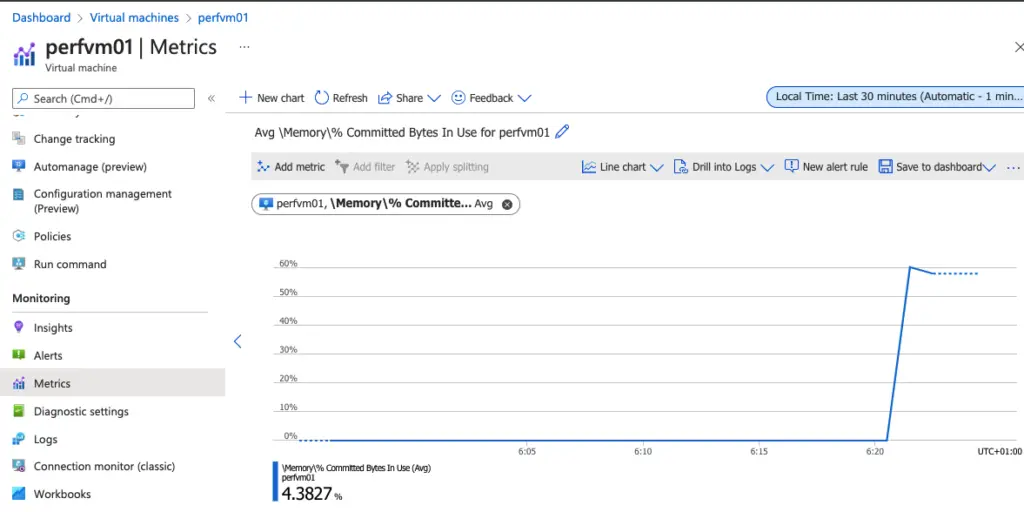
To monitor the memory, we use the parameter %memory committed
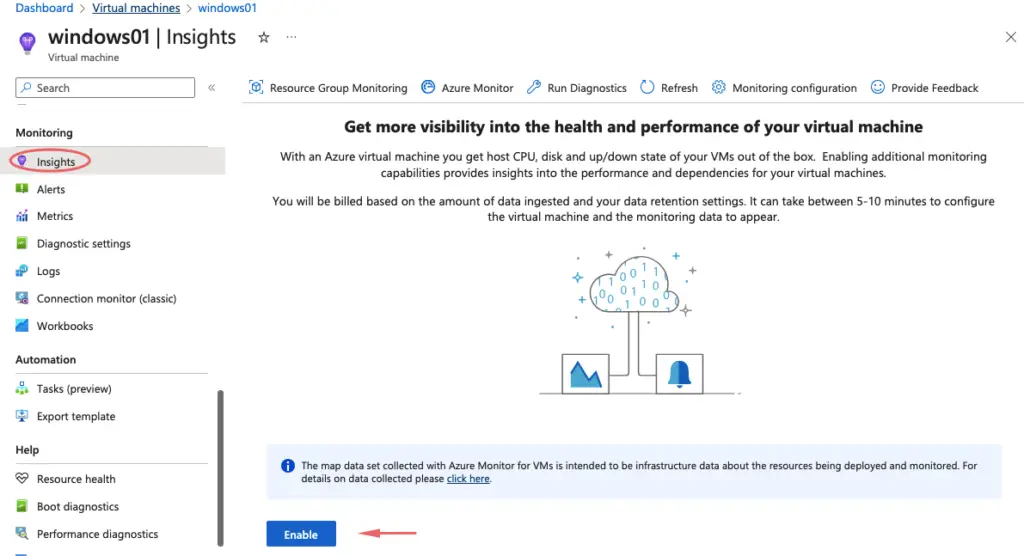
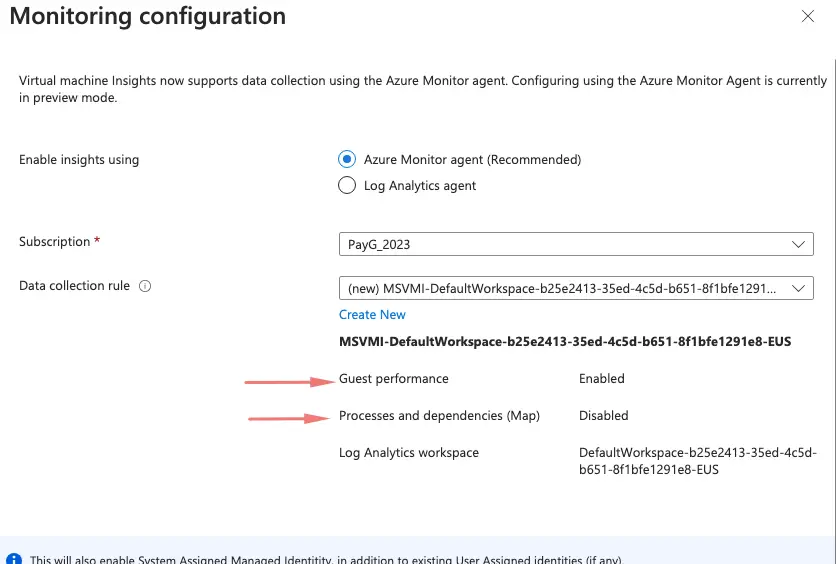
Azure VM Insights
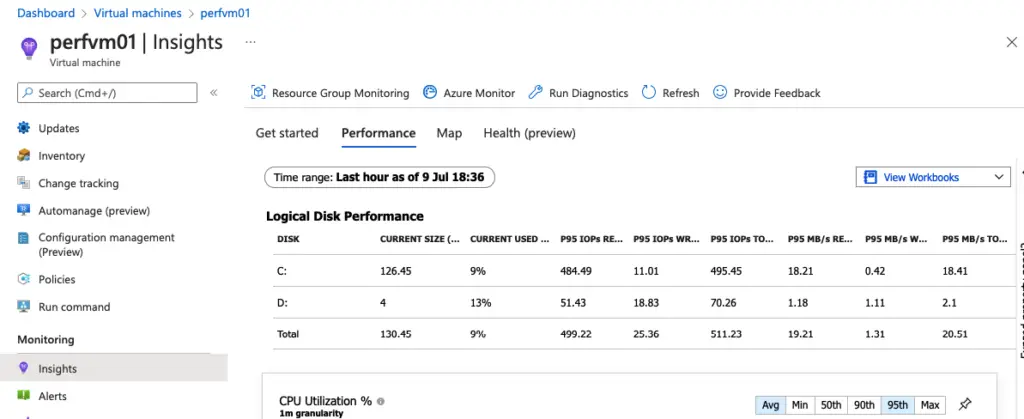
This helps us get more visibility into the health and performance of our virtual machine. With an Azure virtual machine, you get the host CPU, disk and up/down state of your VMs out of the box. Enabling additional monitoring capabilities provides insights into the performance and dependencies of your virtual machines. To monitor, disk utilisation go to Insights and enable the setting
Click Enable setting
Choose Azure monitoring agent and Click Create
Dependency maps showing what’s on the VM can be easily produced as shown

Likewise, we can drill down the disk layers as well. Log Analytics account is needed and it’s a central place to store all the metric logs collected by the Azure monitor.
Once the Log Analytics account captures a few metrics, we can see the utilisation report as shown
Detailed disk stats is displayed
CPU utilization

Memory utilization

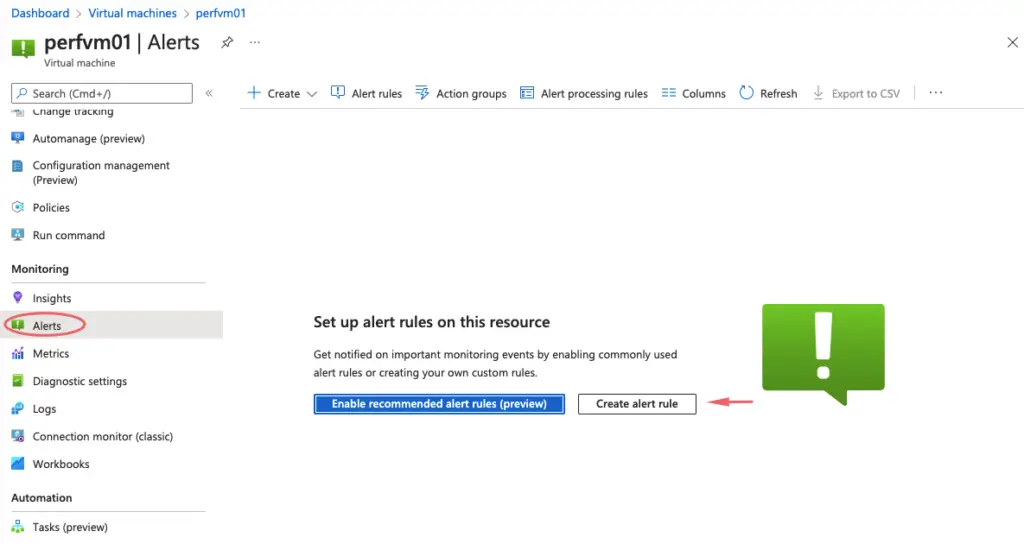
Creating Alert rules for specific events
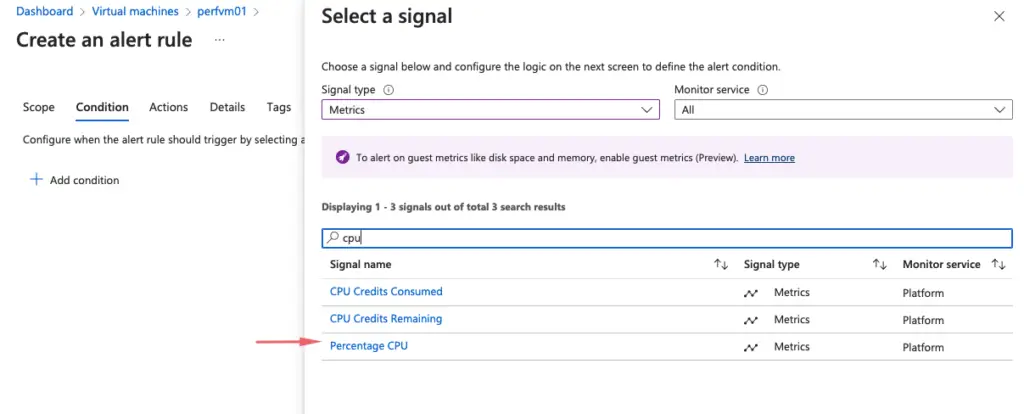
Choose Metrics as Percentage CPU
Under Alert rules, choose CPU high threshold value needed
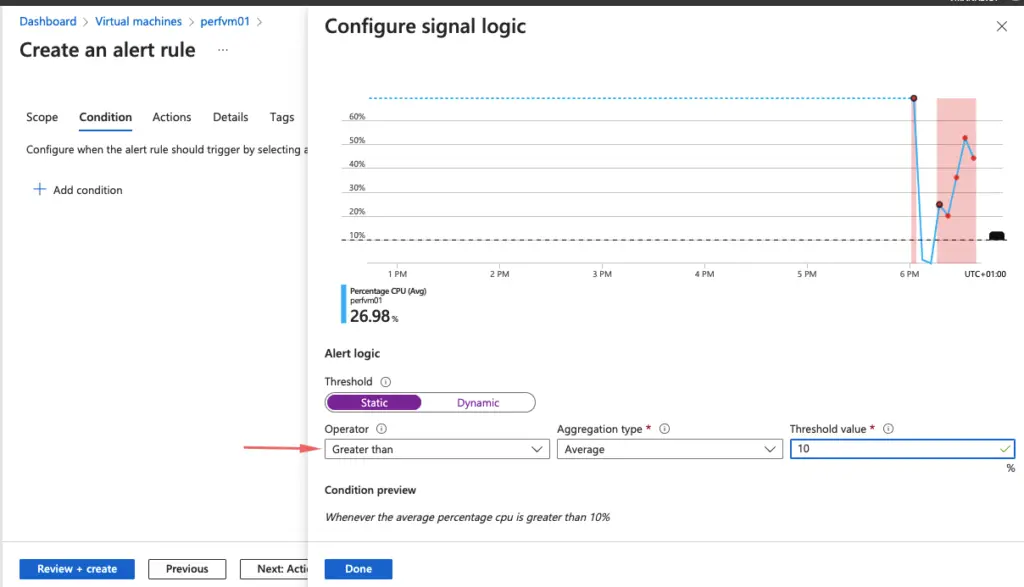
Under Alert rules, choose CPU low threshold value needed

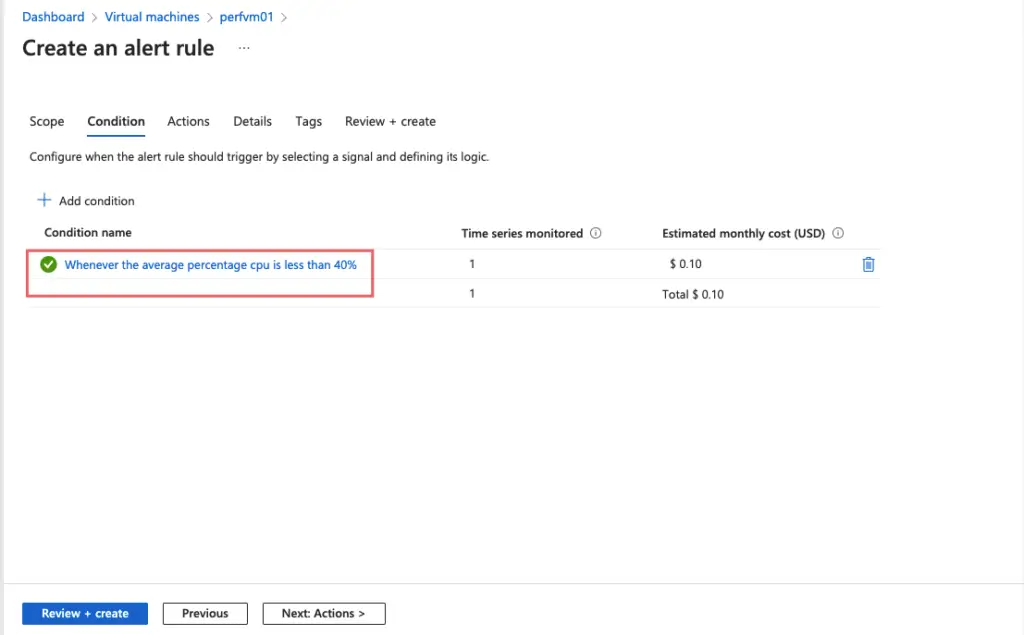
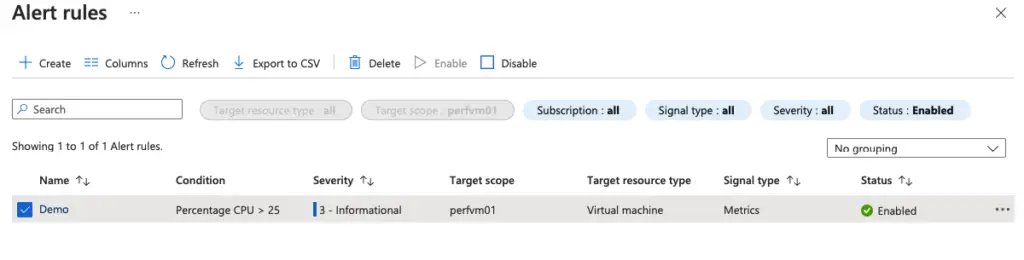
Our alert is now set
Choose the option to create an action group

Give action group a name

Leave it at default
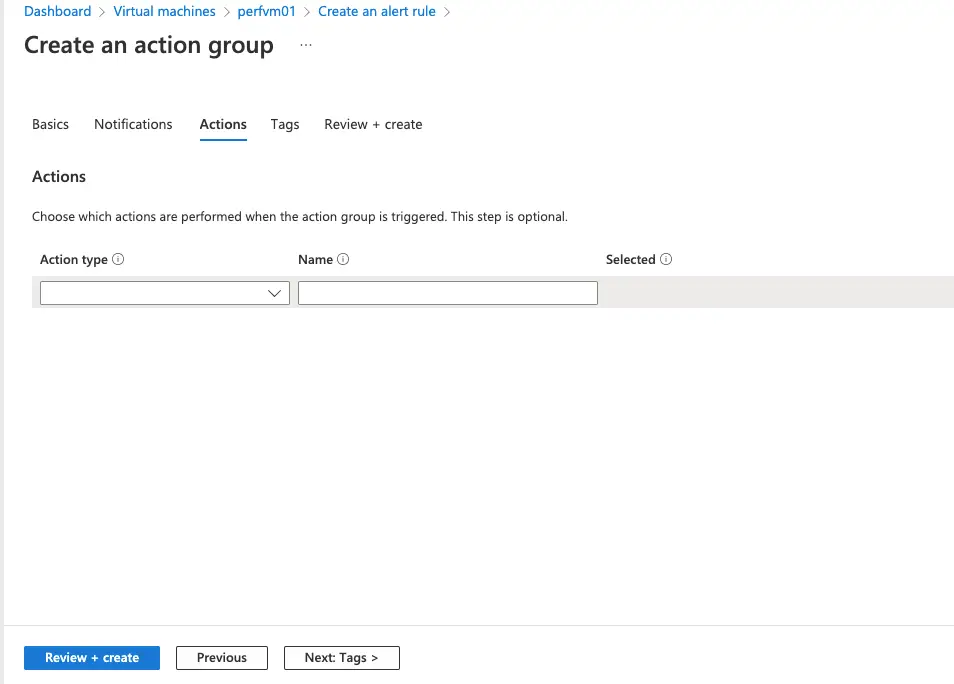
Create action group

Review our metric values set.

Our alert rule is now set
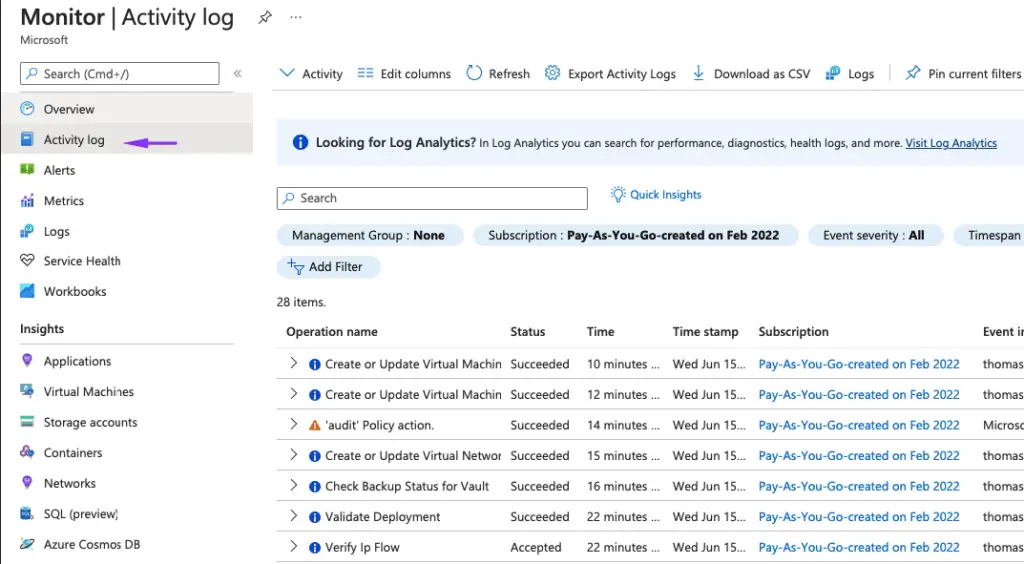
As alerts are being triggered,we will get it logged as shown

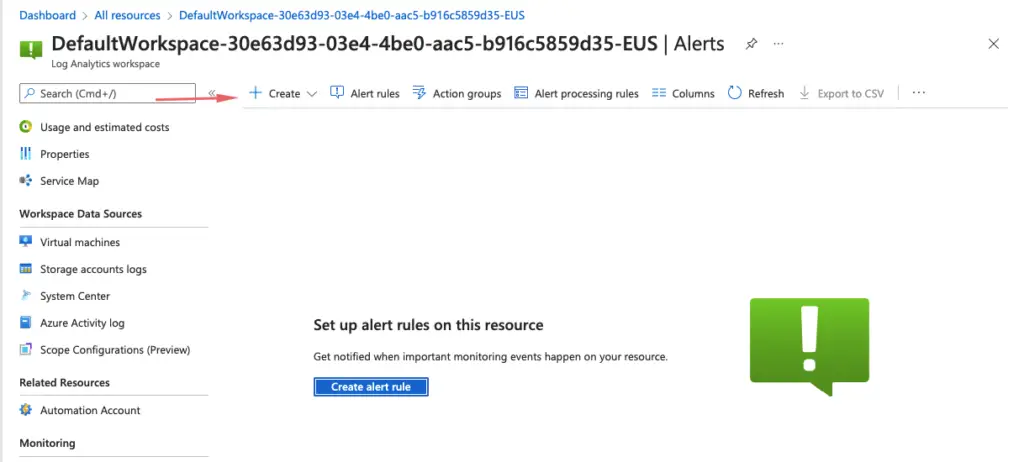
The custom alert can be obtained from the Log Analytics workspace
Choose Custom log search

Who has performed an Activity?
What are Action Groups?
This works similar to the Simple notification service (SNS ) in AWS. On reaching a threshold, we will be notified by SMS or email to alert us to activate an alert
eg: Take action when a CPU level has been reached.
Create Action Group

Give the action group a name

Provide the email/phone for alert

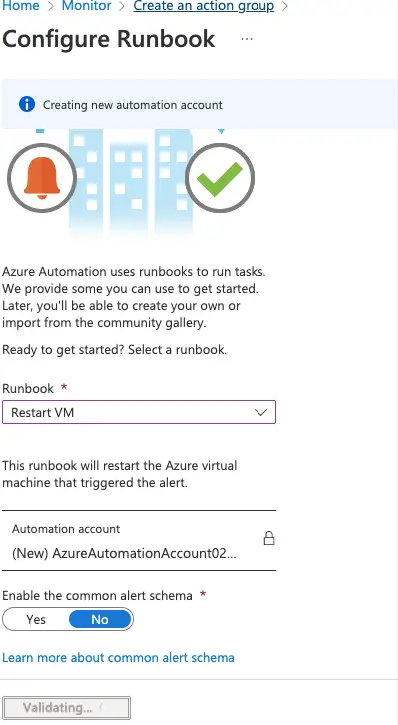
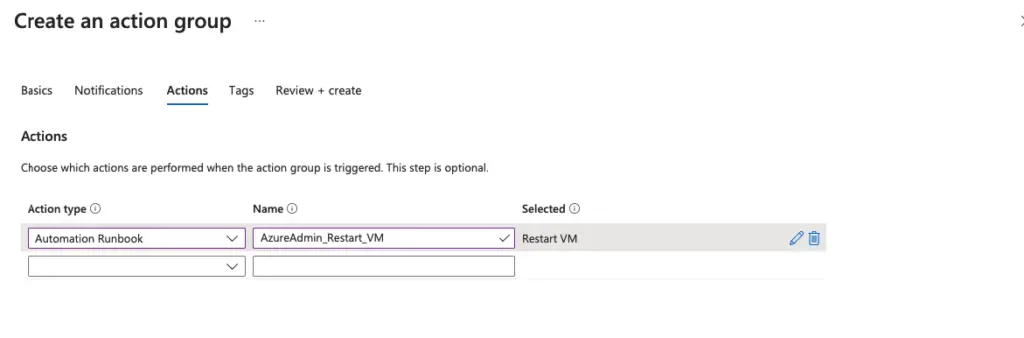
Our runbook is set to restart a VM on reaching an alert
All done and we should now be getting an alert when an alert is triggered.
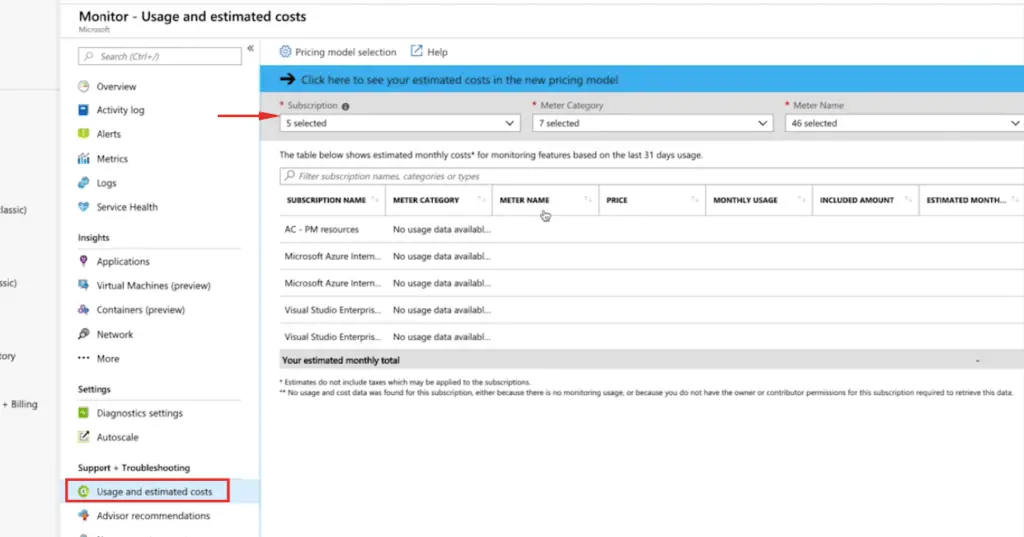
Monitoring and Reporting on Spend
Azure has a TCO calculator, that helps us to understand if a service is utilised correctly and gives us detailed pricing information for each service to improve efficiency in billing.
Service Health
Service health is a sanity check on the Azure end to see if all Azure services are working okay

Azure Alerts
Monitor Spends which is same as AWS and is used to to grant someone else access to billing dashboard
